1. Tourist Arrivals over the Years
This graph shows you the growth rate of tourist arrivals to Sabah on number of years you choose. You can see the increase / decline of international and domestic tourists (Malaysia) over the years.
• Last year same period was:
1,177,701 (17.25% growth)
• Total number of tourist arrivals in year 2025:
3,793,709
Want to know what are the peak months of tourists? Which countries visit Sabah the most? The growth rate of tourist arrivals in last 5 years? This website lets you analyse the trends of tourist arrivals to Sabah, Malaysia, with interactive graphs and charts.
Tourist arrival means number of visit, not number of unique tourist. For example, if a unique tourist visits Sabah 5 times, it's counted as 5 tourist arrivals. The statistics also discounts the arrivals of immigrants who come here to work.
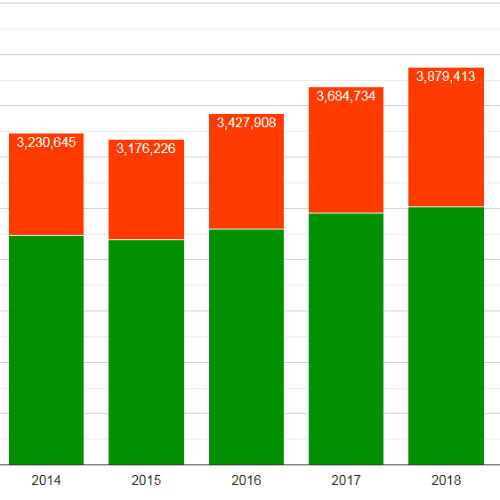
This graph shows you the growth rate of tourist arrivals to Sabah on number of years you choose. You can see the increase / decline of international and domestic tourists (Malaysia) over the years.
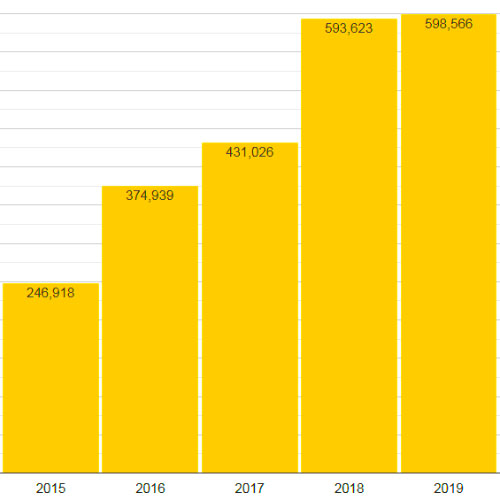
You can monitor the trend of tourists who visit Sabah from your target country. This is useful to check if your favorite target market is growing.
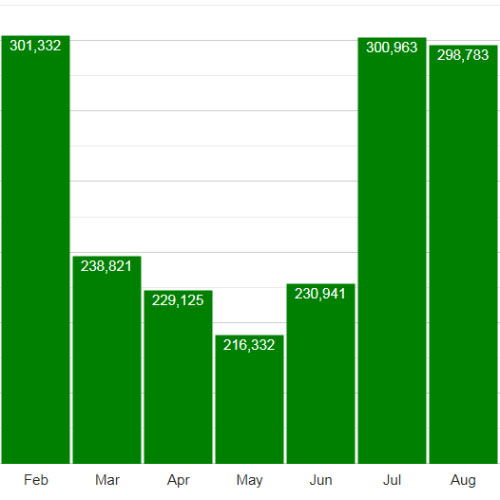
Some months we have many China tourists, some months Australians. By knowing the peak and low travelling seasons of tourists from different country, you can time your marketing more effectively.
After understanding the mix of foreign tourists, you can develop or customise your tourism products such as local food based on their liking. Domestic tourist (Malaysia) is not included in the list.